Algorithm on the Oche: Darts World Matchplay 2024
World Matchplay 2024
The 31st edition of the World Matchplay brought the heat to Blackpool’s Winter Gardens last week, serving up nine days of enthralling darts action. When the dust settled, it was Luke Humphries who stood tall, clinching his first World Matchplay title in a thrilling 18-15 final against Michael van Gerwen. Humphries was on fire throughout the tournament, kicking things off with a blistering 108.76 average in his first-round match - the highest of the competition, and averaging over 100 against all five of his opponents.
The 2024 World Matchplay also introduced five new faces to the prestigious Blackpool stage, including teenage sensation Luke Littler. Fresh from his victory over Luke Humphries in May’s Premier League Final, Littler entered the tournament as an unseeded player, yet a popular tournament favourite. His debut, however, was cut short by Michael van Gerwen in a ruthless first-round encounter. Van Gerwen’s strong performance set him on a path to the final, where he ultimately lost out to Luke Humphries.
Aside from big-name match-ups, the tournament had excitement coming from all directions. Dimitri Van den Bergh thrilled the Winter Gardens crowd with the Matchplay’s first nine-darter since Gerwyn Price two years prior. Defending champion Nathan Aspinall, hampered by injuries, saw his title defence end in the second round against James Wade, who had barely qualified in the final Order of Merit spot.
Wade, a perennial Matchplay contender, defied expectations by powering through to the semi-finals. There, he put up a valiant effort against Luke Humphries, posting the third-highest average of the entire tournament. However, it wasn’t enough to halt Humphries’ momentum on his way to the title.
The question that ultimately interested me was “Was this an outcome we saw coming?”
Well, before the first dart was thrown, I decided to put my data science and machine learning skills to the test in this domain. I developed an algorithm to predict both individual match results and the overall tournament outcome, updating it daily as the competition unfolded. Now that the dust has settled, it is time to explore the overarching success of this approach. How possible is it to predict darts matches?
The Algorithm
The predictive model was implemented in Python, leveraging its robust ecosystem of data science and machine learning libraries - Particularly Pandas, Numpy, Scikit-Learn and Matplotlib. This choice of language allowed for efficient data manipulation, statistical analysis and the implementation of complex, parallel algorithms where necessary.
At the heart of the model lay a hybrid exploration approach, combining machine learning techniques with an ELO ranking system. This fusion aimed to capture both the nuanced patterns that machine learning can detect and the proven track record that ELO rankings provide in competitive scenarios.
The ELO system was implemented using a ‘half-life’ approach to historical data. This method assigned greater weight to recent performances, with a player’s rating contribution halving every 365 days into the past. (For example, a match from two years ago would only contribute a quarter of its original weight to a player’s current rating.) While this ensured that the model remained responsive to current form, it also necessitated recalculating ELO ratings on all historical data (for which data was captured dating back to 1994 (≈ 76,000 matches)) with each update. This process was computationally intensive, requiring significant processing power and optimized code to effectively manage the scale of the dataset.
The ELO algorithm worked by assigning each player a rating. When two players competed, their ratings were used to calculate an expected outcome. Post-match, ratings were adjusted based on the actual result versus the expected one. Winners gained points and losers lost points, with the magnitude of change influenced by the rating difference and the unexpectedness of the result.
1
2
3
4
5
6
7
8
9
10
11
12
13
14
15
16
17
18
19
20
21
22
23
24
25
26
27
28
29
30
def update_overall_elo(match_result, home_elo, away_elo, k=32, scaling_factor=400):
    """
    Update the ELO ratings of two players based on a match result.

    Args:
        match_result (dict): A dictionary containing information about the match result.
        home_elo (float): The ELO rating of the home team.
        away_elo (float): The ELO rating of the away team.
        k (float, optional): The scaling factor for the ELO rating. Was chosen to default to 32 (standard value for ELO ratings).
        scaling_factor (float, optional): The scaling factor for the ELO rating. Was chosen to default to 400 (standard value for ELO ratings).
    """
    # Get the current date using time as YYYY-MM-DD
    current_date = time.strftime("%Y-%m-%d", time.localtime())
    day_difference = (pd.Timestamp(current_date) - pd.Timestamp(match_result['date'])).days
    recency_weight = 0.5 ** (day_difference / 365)
    adjusted_k = k * recency_weight

    # Calculate the expected score for each team
    home_expected = 1 / (1 + 10 ** ((away_elo - home_elo) / scaling_factor))
    away_expected = 1 / (1 + 10 ** ((home_elo - away_elo) / scaling_factor))

    # Calculate the actual score (1 for win, 0 for loss)
    home_actual = 1 if match_result['home_team_legs_won'] > match_result['away_team_legs_won'] else 0
    away_actual = 1 - home_actual

    # Update the ELO ratings
    home_elo_new = home_elo + adjusted_k * (home_actual - home_expected)
    away_elo_new = away_elo + adjusted_k * (away_actual - away_expected)

    return home_elo_new, away_elo_new
(Above) A function to that uses previous ELOs and the actual match outcomes to adjust new ELO ratings accordingly.
1
2
3
4
5
6
7
8
9
10
11
12
13
14
15
16
17
18
19
20
21
22
23
24
25
26
27
28
29
30
31
32
33
34
# The completion of this process assumes:
# - A darts_matches dataframe containing information about darts games and their results
# - A players_elo dictionary containing the current ELO ratings of each player

# For each result (row) in the df...
for index, match in darts_matches.iterrows():
    home_elo = players_elo[match['home_team']]
    away_elo = players_elo[match['away_team']]

    # Sets the ELO to the current ELO value in the players_elo dictionary.
    darts_matches.loc[index, 'home_team_elo'] = home_elo
    darts_matches.loc[index, 'away_team_elo'] = away_elo

    # Prepares a basic match result dictionary for use by the function.
    match_result = {
        'home_team_legs_won': match['home_score'],
        'away_team_legs_won': match['away_score'],
        'date' : match['date']
    }

    # This is the point where the function in the previous code block is called.
    home_elo, away_elo = update_overall_elo(match_result, home_elo, away_elo)

    # ELOs are updated in the darts_matches dataframe with the new ELOs
    darts_matches.loc[index, 'home_team_elo'] = home_elo
    darts_matches.loc[index, 'away_team_elo'] = away_elo

    # The new ELO ratings are also updated in the players_elo dictionary to be used for players' next games.
    players_elo[match['home_team']] = home_elo
    players_elo[match['away_team']] = away_elo

# If wanting to display the up to date ELO rankings:
print('ELO Rankings:')
display(pd.DataFrame.from_dict(players_elo, orient='index', columns=['Elo']).sort_values(by='Elo', ascending=False))
(Above) Calling the ELO function and updating the relevant values in the ‘darts_matches’ and ‘players_elo’ dictionaries for each match in the ‘darts_matches’ dataframe.
The model then utilized these ELO ratings in conjunction with the tournament draw to simulate potential outcomes. Each match-up’s win probability was calculated based on the players’ ELO ratings, in tandem with the outputs of a random forest model using a wider range of stats as input data. (The ELO ratings were found to ultimately hold more predictive weight in this scenario.) The entire tournament was then simulated 100,000 times, using these probabilities to simulate match outcomes, based on random number generation. (This is similar to the Monte Carlo approach in my previous write-up - worth checking out if you are unfamiliar.) Using this approach, it was possible to account for all possible combinations of future opponents for games that had not yet been played, suitably capturing variance in match outcomes.
From these simulations, the model calculated the percentage chance of each player reaching various stages of the tournament. These percentages were derived from the win rates in each round across all simulations, providing a comprehensive view of each player’s prospects throughout the tournament.
The implementation for the process described above is rather complex, so the below pseudocode outlines the overarching simulatory process.
1
2
3
4
5
6
7
8
9
10
11
12
13
14
15
16
17
18
19
20
21
22
23
24
25
26
27
28
29
30
31
32
33
34
35
# SIMPLIFIED PSEUDOCODE IMPLEMENTATION
# The following function implementations are not shown:
# - simulate_game(home_player, away_player) - Returns the simulated winner of the game based on ELO probabilites and random number generation
# - update_tournament_bracket(winner, home_player, away_player) - Updates tournament bracket for single simulation with winner
# - update_player_results(player_results_df, single_tournament_result) - Increments values for each player based on results of simulation

# A pandas dataframe stores the number of times a player reaches each of the possible rounds
player_results_df = pd.Dataframe()

def simulate_tournament(tournament_bracket_info):
    """
    Simulates a single tournament

    Args:
        tournament_bracket_info (list of dics): Directed graph structure used to highlight the relationship of matches and potential future matches.
    """

    # For all rounds
    for round in tournament_bracket_info:
        # For all games in a round
        for game in round:
            # Use the ELOs to simulare the winner of a game based on win probabilities
            winner = simulate_game(home_player, away_player)
            # Update the tournament info for further down the bracket
            tournament_bracket_info = update_tournament_bracket(winner, home_player, away_player)

    # Return the completed bracket
    return tournament_bracket_info

# Directed graph structure used to highlight the relationship of matches and potential future matches.
tournament_bracket_info = [{...}, {...}, ...]
# Updates the player_results_df for each of the 100,000 simulations of the tournament.
for i in range(100000):
    single_tournament_result = simulate_tournament(tournament_bracket_info)
    update_player_results(player_results_df, single_tournament_result)
(Above) The pseudocode for the tournament simulation process.
This approach demanded significant computational resources. Running 100,000 simulations for a tournament with multiple rounds and numerous players required efficient algorithms and parallel processing capabilities. Moreover, as new results came in and ELO ratings were updated, these simulations needed to be rerun, making real-time or daily updates somewhat computationally expensive.
To address these challenges and ensure smooth operation, the implementation of this model necessitated the development of robust data pipelines. These pipelines seamlessly integrated new match results, dynamically updated ELO ratings, and efficiently reran simulations. This end-to-end process embodied a sophisticated fusion of statistical methodologies, advanced data representation and storage techniques, and (initially) exploration of cutting-edge machine learning algorithms. The result was a comprehensive system that not only predicted outcomes but also adapted in real-time to the evolving landscape of the tournament, showcasing the power of data-driven approaches in sports analytics.
The tournament wide model probabilities, as well as the probabilites for individual matches, can be seen under the ‘Model Predictions’ section below. Some further statistical exploration and evaluation of the model can then be found in the ‘Model Evaluation & Tournament Analysis’ section.
Model Predictions
The ‘Interactive Outcome Probabilities Table’ shows the probabilities for all players reaching different rounds of the competition. The dropdown can be used to explore how these probabilities changed as the tournament progressed.
The ‘Match-by-Match Results’ breaks down all of the scores for all of the games in the tournament, highlighting the probability of victory for each player, as determined by the model.
Interactive Outcome Probabilities Table
Select a day from the dropdown to explore the interactive probabilites for tournament outcome on a player-by-player basis.
| Name | Last 32 | Last 16 | Quarter Final | Semi Final | Final |
|---|
[The table may not fit on your screen. If this is the case, scroll horizontally to view the columns for all of the possible rounds.]
Match-by-Match Results
Last 32
2024-07-13
| Player | Win Probability | Score | Win Probability | Player |
|---|---|---|---|---|
| Gerwyn Price | 57.2% | 10-4 | 42.8% | Daryl Gurney |
| Jonny Clayton | 65.9% | 10-7 | 34.1% | Raymond van Barneveld |
| Luke Humphries | 83.1% | 10-4 | 16.9% | Ricardo Pietreczko |
| Nathan Aspinall | 58.2% | 10-8 | 41.8% | Luke Woodhouse |
2024-07-14
| Player | Win Probability | Score | Win Probability | Player |
|---|---|---|---|---|
| Ross Smith | 64.2% | 10-4 | 35.8% | Josh Rock |
| Danny Noppert | 59.5% | 5-10 | 40.5% | James Wade |
| D. Van den Bergh | 41.0% | 10-6 | 59.0% | Martin Schindler |
| Stephen Bunting | 48.5% | 12-10 | 51.5% | Ryan Joyce |
| Rob Cross | 68.0% | 13-12 | 32.0% | Gian van Veen |
| Joe Cullen | 32.3% | 10-4 | 67.7% | Brendan Dolan |
| Peter Wright | 47.6% | 5-10 | 52.4% | Andrew Gilding |
| Dave Chisnall | 65.9% | 2-10 | 34.1% | Krzysztof Ratajski |
2024-07-15
| Player | Win Probability | Score | Win Probability | Player |
|---|---|---|---|---|
| Damon Heta | 51.8% | 4-10 | 48.2% | Ryan Searle |
| Michael Smith | 48.8% | 10-5 | 51.2% | Gary Anderson |
| Michael van Gerwen | 34.4% | 10-6 | 65.6% | Luke Littler |
| Chris Dobey | 52.4% | 10-7 | 47.6% | Ritchie Edhouse |
Last 16
2024-07-16
| Player | Win Probability | Score | Win Probability | Player |
|---|---|---|---|---|
| Gerwyn Price | 41.1% | 9-11 | 58.9% | Ross Smith |
| Nathan Aspinall | 54.4% | 8-11 | 45.6% | James Wade |
| Luke Humphries | 64.4% | 11-7 | 35.6% | Stephen Bunting |
| Jonny Clayton | 71.4% | 5-11 | 28.6% | D. Van den Bergh |
2024-07-17
| Player | Win Probability | Score | Win Probability | Player |
|---|---|---|---|---|
| Krzysztof Ratajski | 50.8% | 5-11 | 49.2% | Andrew Gilding |
| Rob Cross | 66.4% | 11-6 | 33.6% | Ryan Searle |
| Michael van Gerwen | 79.9% | 11-8 | 20.1% | Joe Cullen |
| Michael Smith | 62.8% | 11-9 | 37.2% | Chris Dobey |
Quarter Finals
2024-07-18
| Player | Win Probability | Score | Win Probability | Player |
|---|---|---|---|---|
| Ross Smith | 68.7% | 10-16 | 31.3% | James Wade |
| Luke Humphries | 70.3% | 16-10 | 29.7% | D. Van den Bergh |
2024-07-19
| Player | Win Probability | Score | Win Probability | Player |
|---|---|---|---|---|
| Michael van Gerwen | 68.6% | 16-10 | 31.4% | Andrew Gilding |
| Michael Smith | 41.1% | 16-7 | 58.9% | Rob Cross |
Semi Finals
2024-07-20
| Player | Win Probability | Score | Win Probability | Player |
|---|---|---|---|---|
| Luke Humphries | 68.5% | 17-10 | 31.5% | James Wade |
| Michael van Gerwen | 45.9% | 17-13 | 54.1% | Michael Smith |
Final
2024-07-21
| Player | Win Probability | Score | Win Probability | Player |
|---|---|---|---|---|
| Luke Humphries | 56.9% | 18-15 | 43.1% | Michael van Gerwen |
Model Evaluation
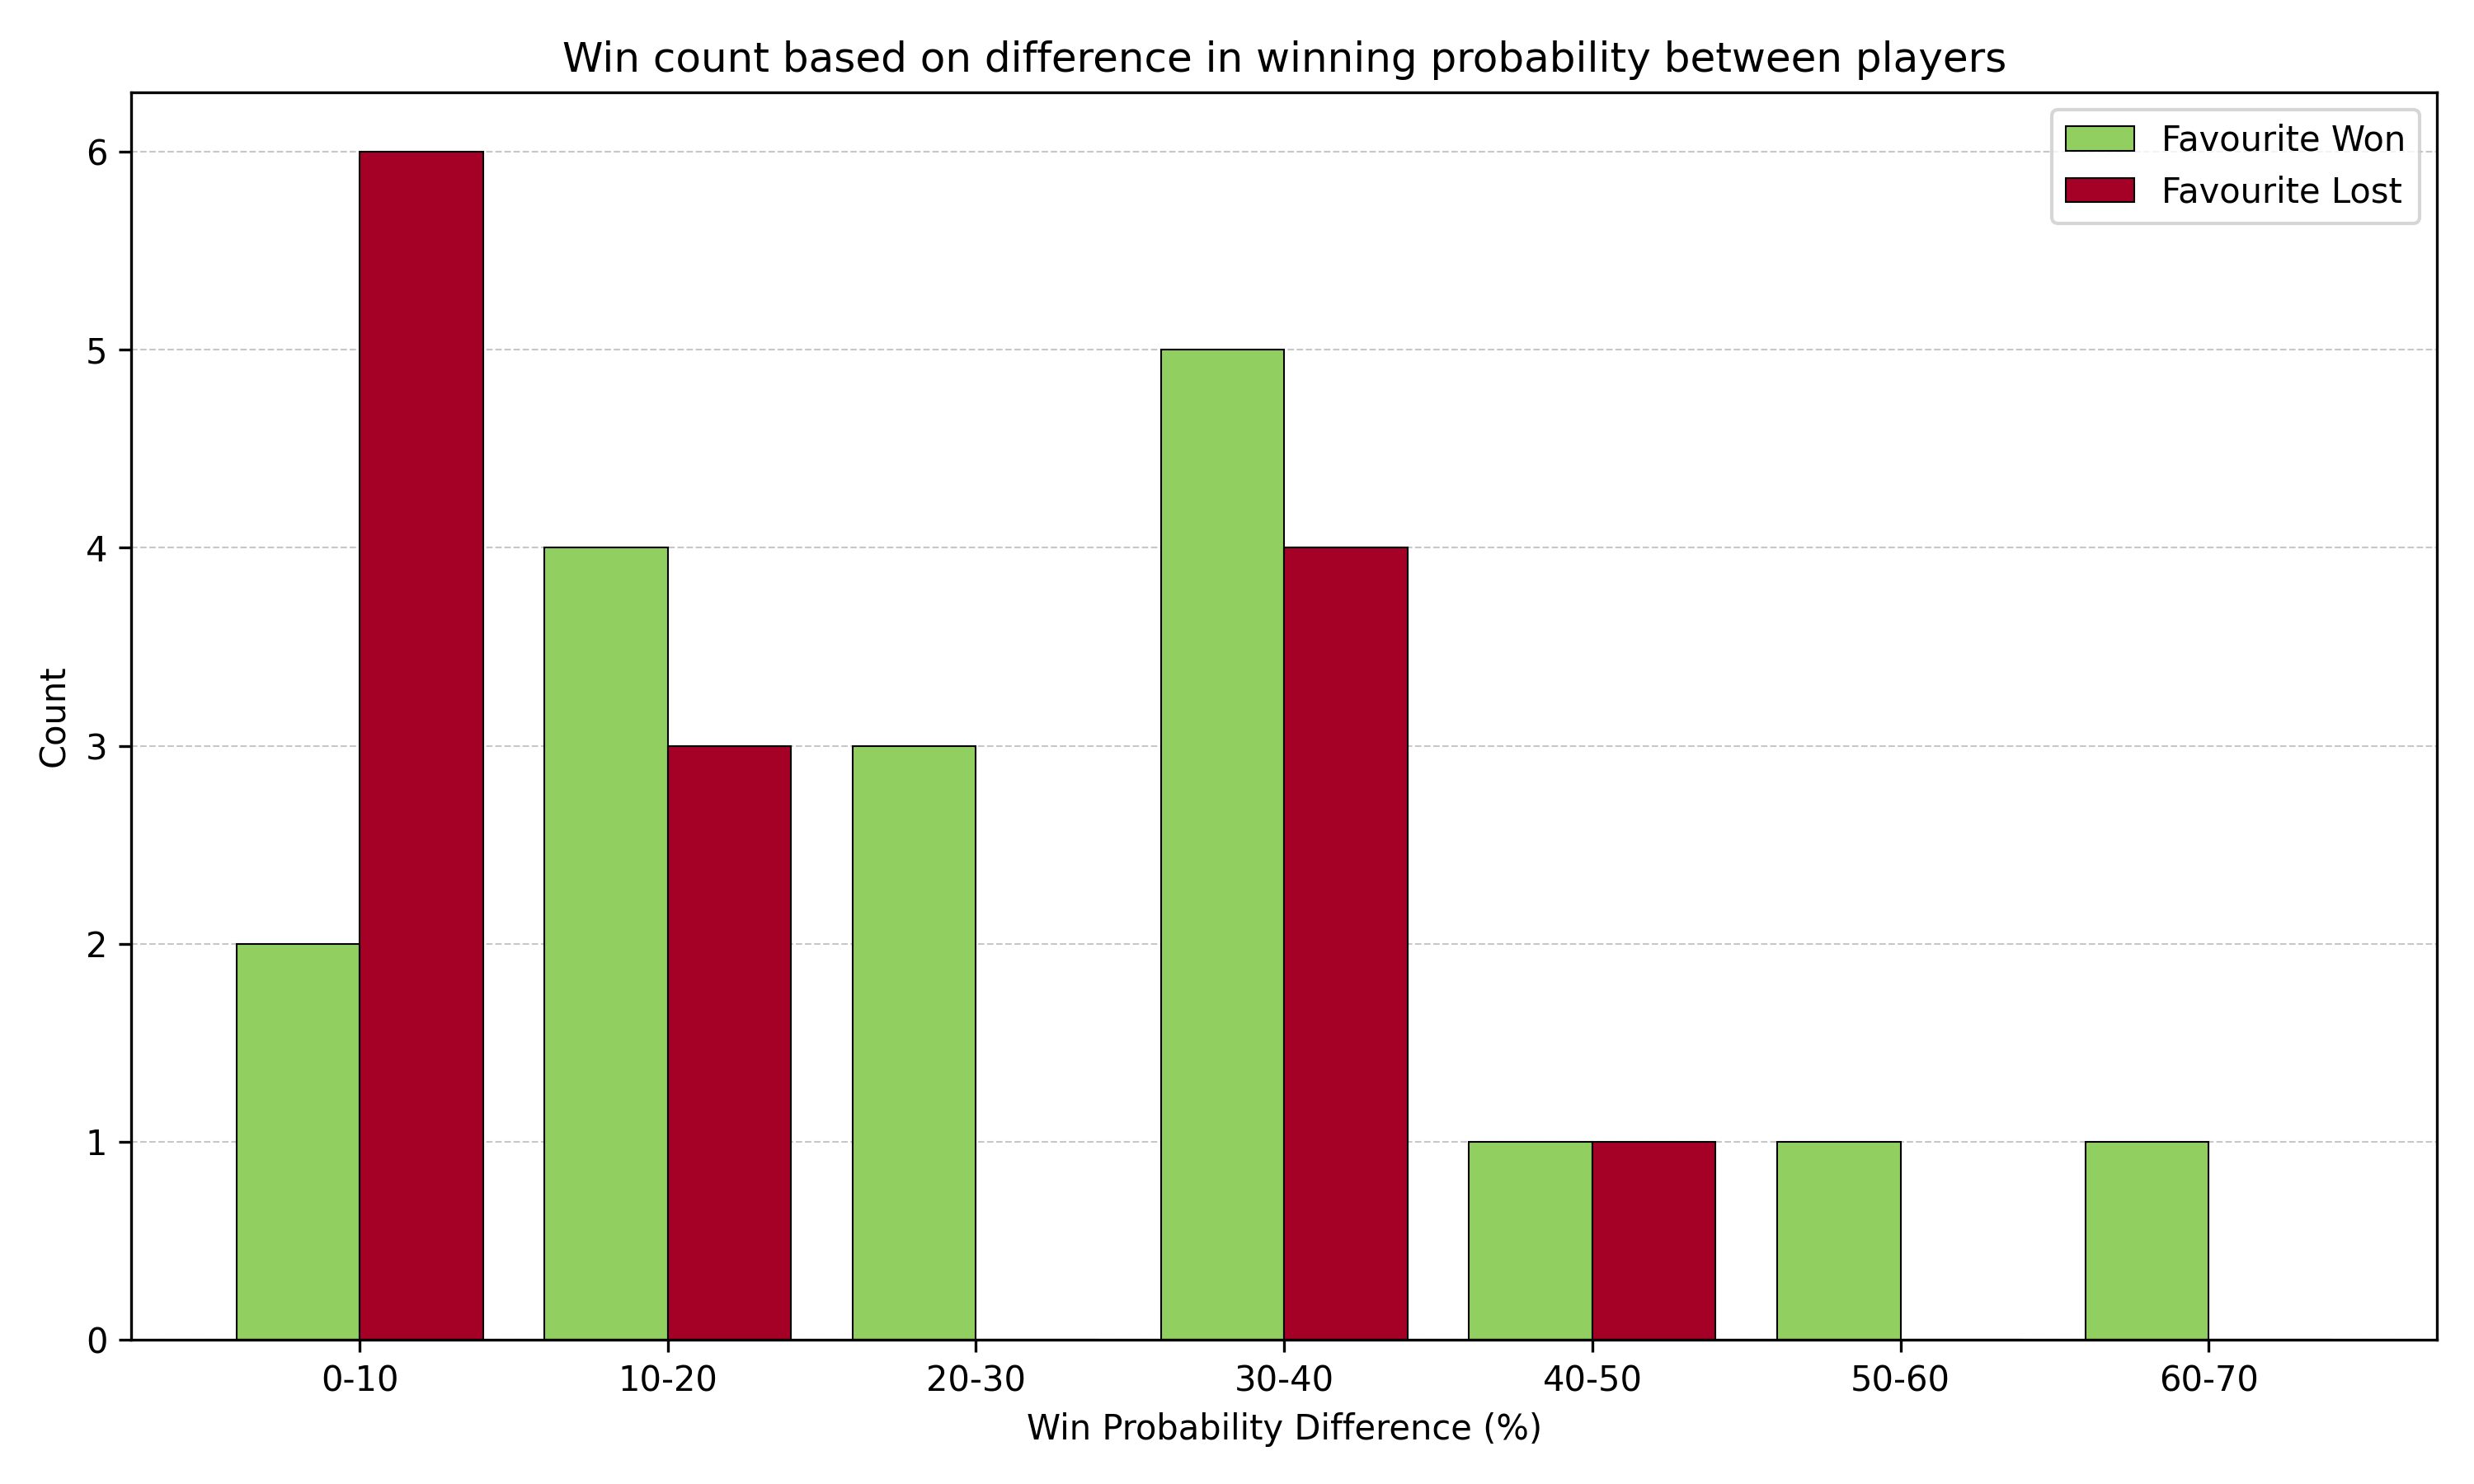 Figure 1: Differences in the success of model favourites based on the gap in win probability between the two players.
Analysing the performance of the predictive model in different win probability ranges, as illustrated in Figure 1, reveals several key insights into its strengths and limitations.
The model appears to demonstrate increasing reliability as the predicted probability difference between players grows, which aligns with the expected behavior of a well-calibrated predictive system. In matches where the model identified clear favorites (over 10% probability difference) 65% of matches correctly sided with the favourite. It is also worth noting that no range in this group saw the favourite win fewer times than they lost, which is also a positive sign. This suggests that the model effectively captures the impact of skill disparities in darts, where higher-ranked players tend to stamp home their advantage, particularly in longer game formats comprised of numerous legs (and sometimes even sets).
However, the model’s performance in very close matches (0-10% probability difference) indicates a potential area for improvement. In these instances, the model underestimated the likelihood of upsets, with underdogs winning more frequently than favorites. This discrepancy could be attributed to the inherent volatility of closely matched darts contests, where factors such as mental fortitude, crowd influence, and day-to-day form fluctuations play crucial roles that may be challenging to quantify in a predictive model. Additionally, the sample size here is relatively small, so it is also very plausible that the performance of the model conforms with variance, inevitable in competitions of this kind.
The distribution of data points across the probability difference ranges also provides additional context about the nature of professional darts competitions. The concentration of matches in the 0-40% difference range (i.e. 50:50 to 70:30 range), with fewer instances of extreme mismatches, reflects the competitive balance typically observed in high-level darts tournaments. This distribution underlines the challenge of creating accurate predictions in a sport where skill levels among top competitors are often closely matched, and so results are by no means a certainty.
In terms of the tournament-long predictive process, the two favourites from the outset were Luke Littler and Luke Humphries, accurately reflecting both players’ quality and the competitiveness of the four quarters of the tournament draw.
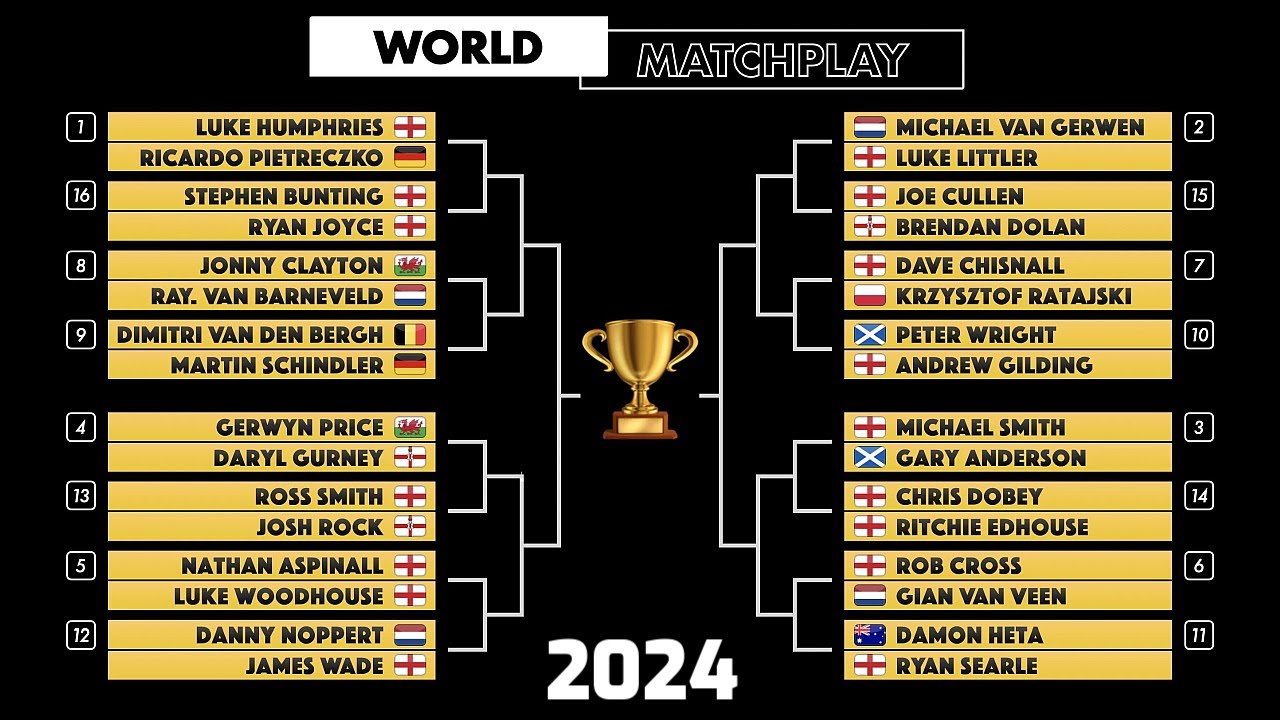 Figure 2: The tournament draw backet for the 2024 World Matchplay.
Whilst Luke Littler did not win in the first round, the man that defeated him, Michael Van Gerwen, did proceed to the final. Here, the model accurately reflected the overall lower quality of opponents along this section of the path to the final. After this 1st round victory over the in-form Littler, Michael Van Gerwen’s tournament favourite odds drastically increased, nearly quadrupling from 3.6% to 12.6%. Humphries at this point held a very similar tournament winning probability, and although he would’ve been favoured in a head to head vs MvG, faced a tougher potential path through to the semis and the final. Figure 3 shows how the win probabilities of these two finalists changed across the tournament. 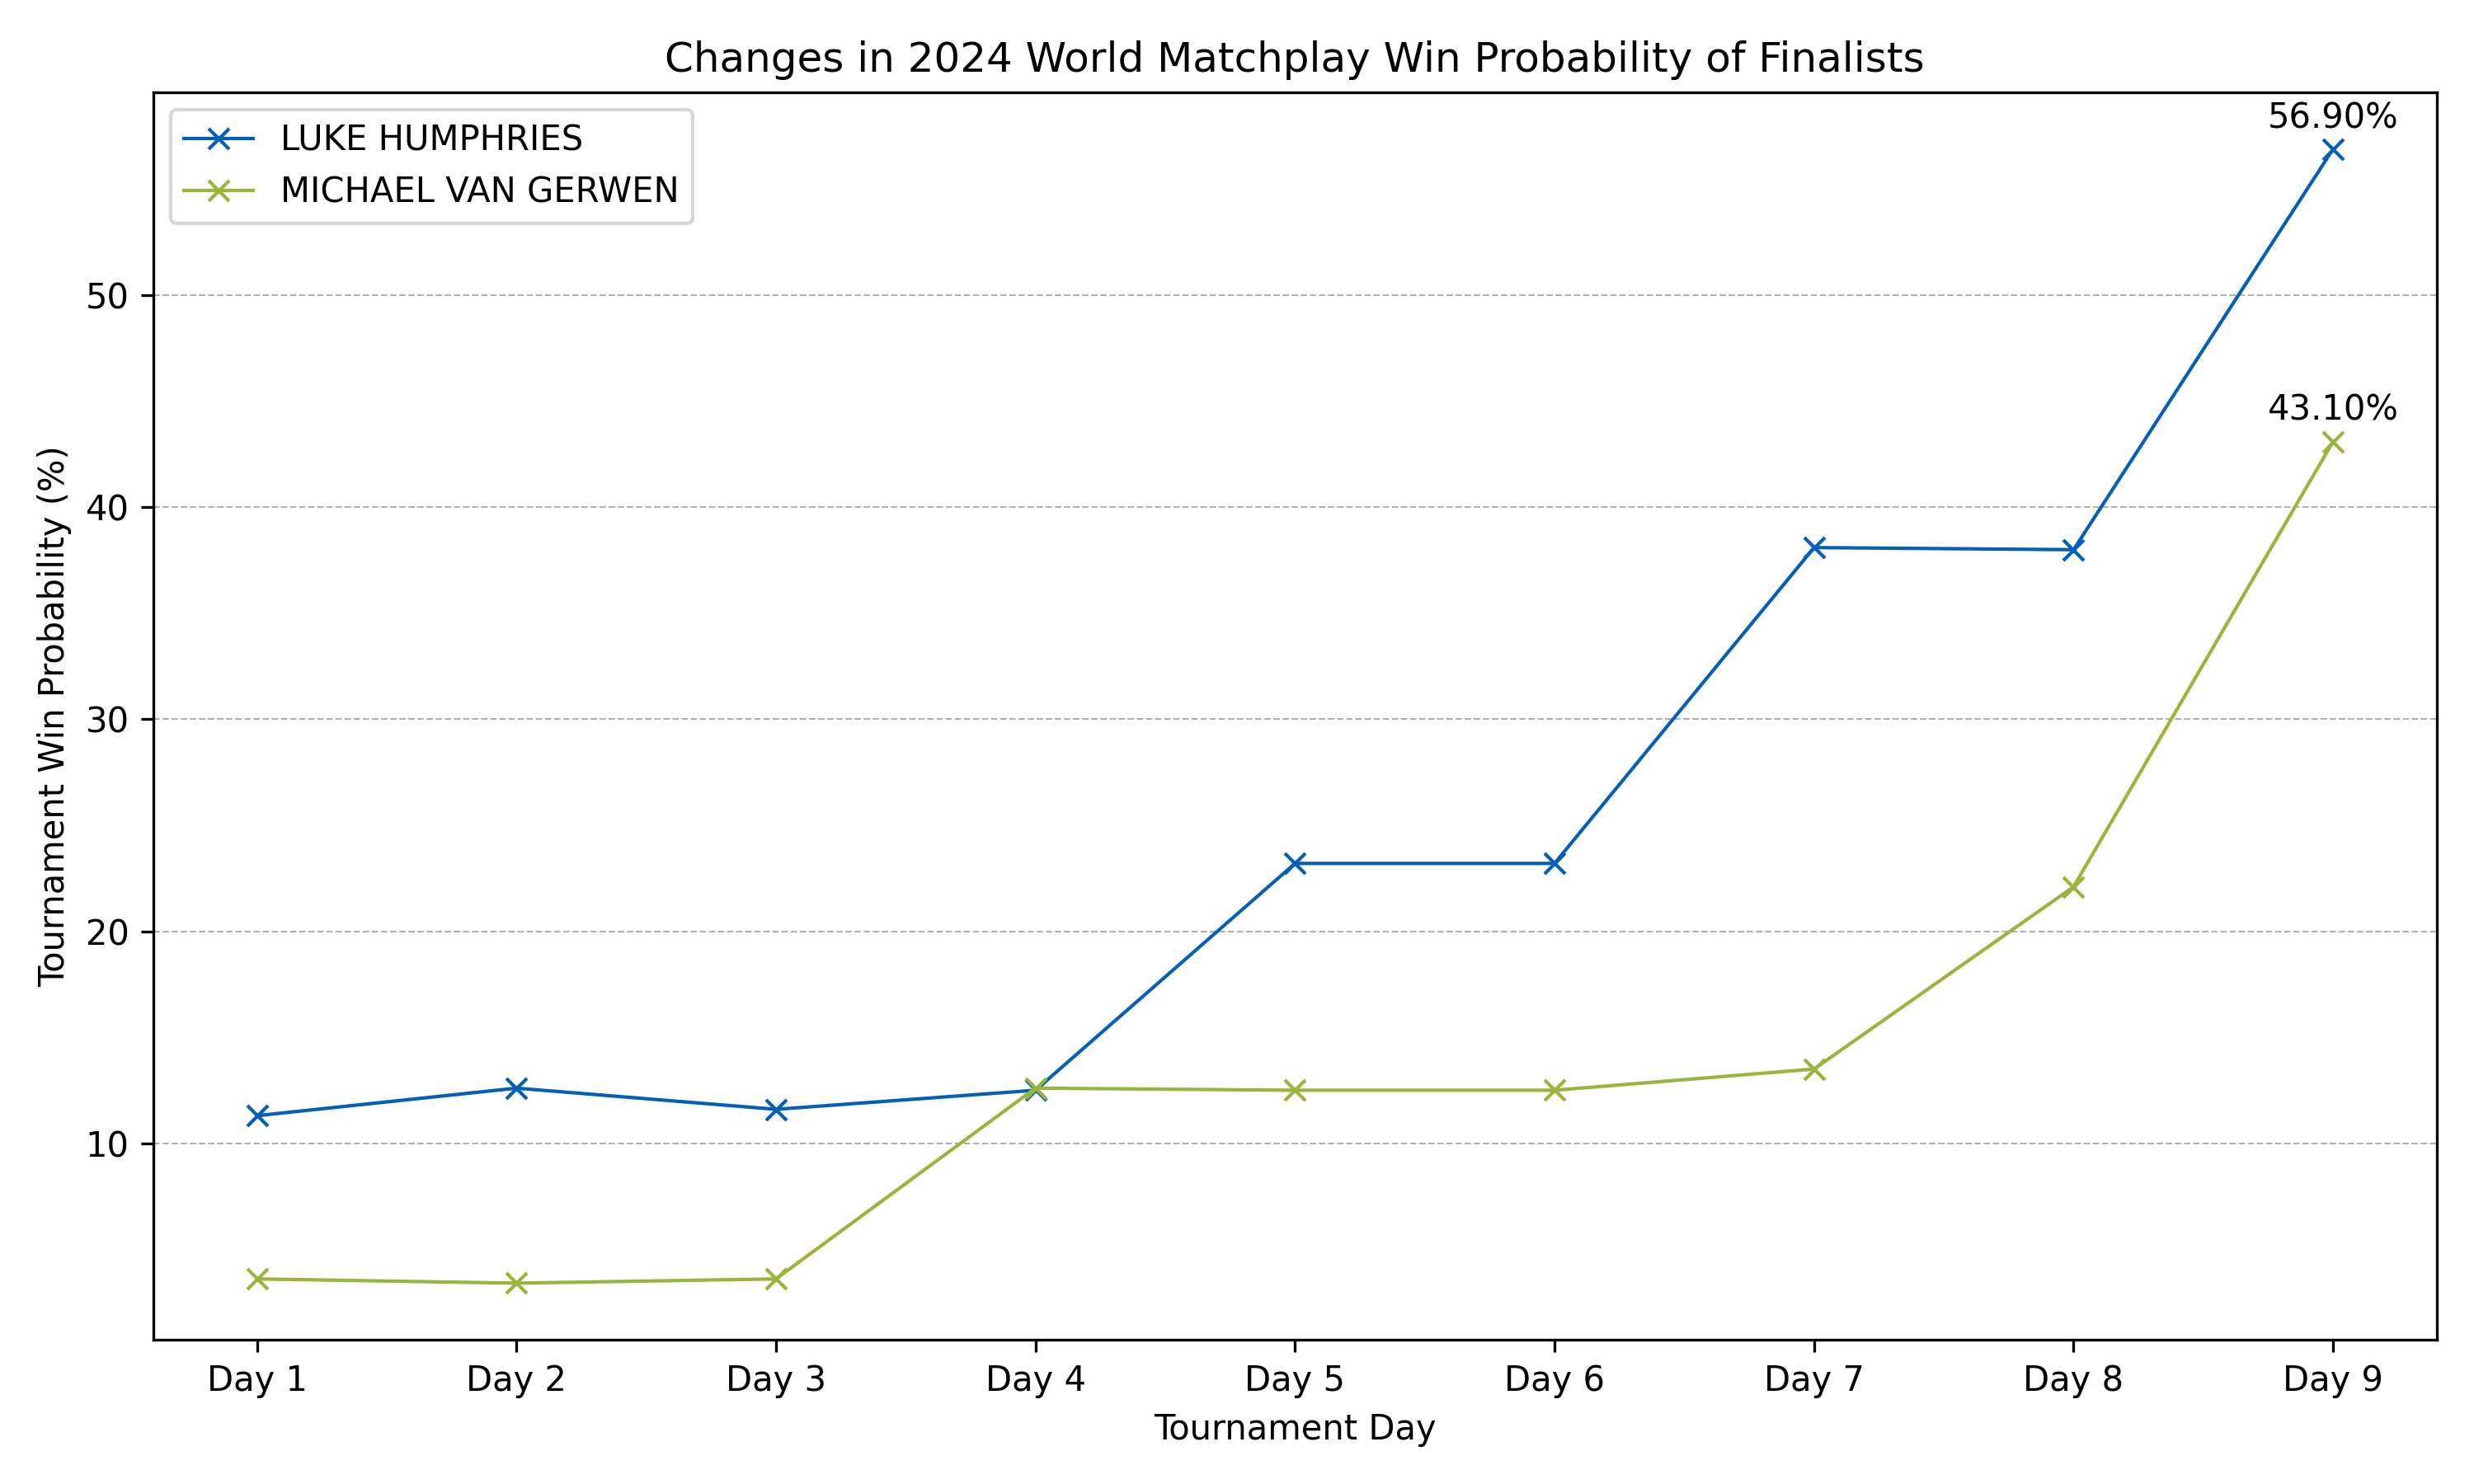 Figure 3: Win probabilities of Luke Humphries and Michael Van Gerwen (finalists) across the 2024 World Matchplay.
Ultimately, there is always going to be variance, and that is half of what the model itself is trying to capture. It considers the likelihood of all results with respect of all the changing varaibles, and in that regard, was a success. It is not possible, nor will it ever be, to perfectly predict the outcome of a competition like this, and that is driving force behind why we it entices us. Future applications of the model will be interesting in highlighting whether the model’s highly imbalanced performance in the 0-10% probability difference range was driven by variance, or a tunable weakness of the model.
Applied Modelling Approach to PDC Predictor
I applied the model, as well as similar modelling techniques for high checkouts, 180s thrown and highest averages, to adopt a statistical approach to the PDC predictor. This light-hearted game involes predicting the various afformentioned aspects for all games across the tournament. My performance in each of the rounds is shown in the table below.
| Session | Number of Entrants | My Finishing Position | Top x% |
|---|---|---|---|
| Evening Session (13th July) | 2618 | 341 | 13.02% |
| Afternoon Session (14th July) | 2130 | 48 | 2.25% |
| Evening Session (14th July) | 2040 | 530 | 26.00% |
| Evening Session (15th July) | 2068 | 1 | 0.04% |
| Second Round A | 891 | 730 | 82.00% |
| Second Round B | 846 | 522 | 61.70% |
| Quarter Finals A | 776 | 114 | 14.70% |
| Quarter Finals B | 617 | 322 | 52.90% |
| Semi-Finals | 608 | 45 | 7.40% |
| Final | 569 | 171 | 30.10% |
This approach was hugely effective, allowing me to score, on average, in the top 29% of players in every single round. The median finishing position, more robust to outliying results, usurped this at the top 20.35% in all rounds. This included a first place finish, as well as separate finishes in the top 2.25% and 7.4% respectively. Unfortunately there is no way to compare overall predictive performance against other players on a tournament-wide scale. But, considering the variability in finishing positions possible between rounds, it is highly likely to have performed ahead of the vast majority of other predictors, given the consistently good performance.
Overall Tournament Analysis
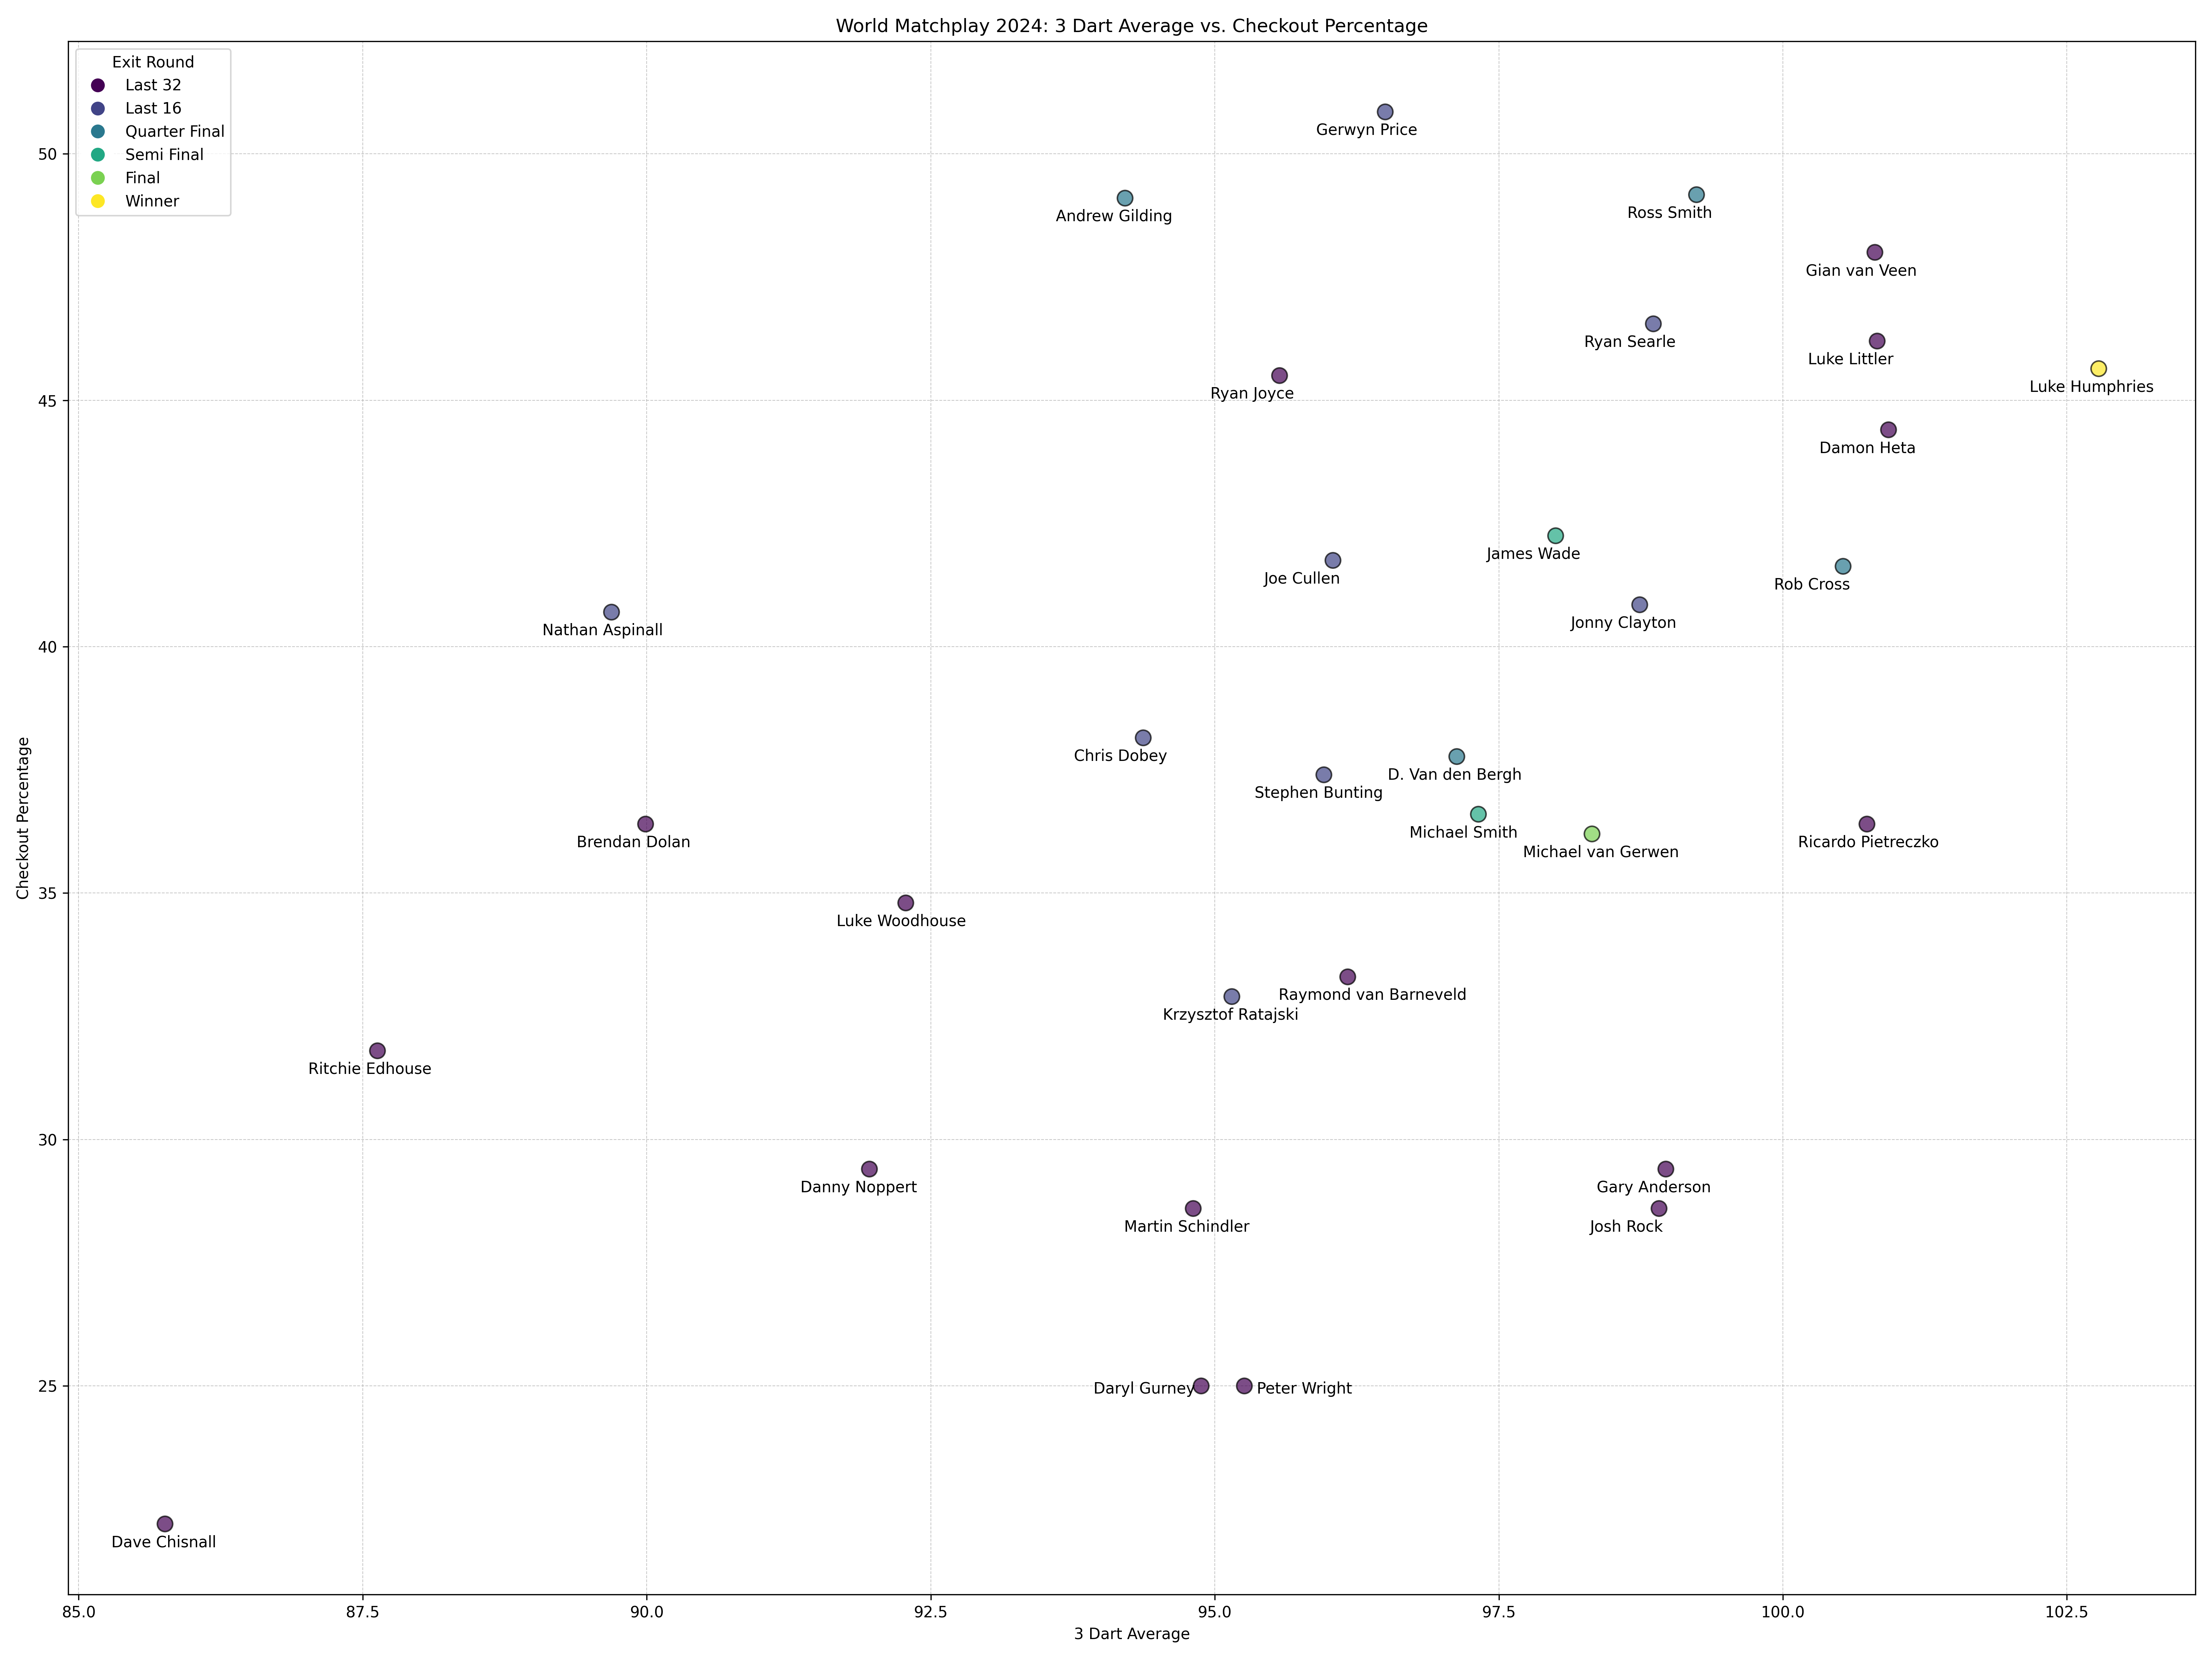 Figure 4: A scatter plot of average tournament 3 dart average against average checkout rate for all players in the 2024 World Matchplay. The upper right quadrant indicates good performance in both measures, and vice versa for the lower left quadrant.
Humphries was ultimately a worth winner, continuing his tremendous form off the back of the 2023 season and victory at the World Championships in January. He posted the highest 3 dart average of the entire tournament, despite playing in the highest number of games. Four other players posted a 100 point average, with Rob Cross the only one of these not to exit the tournament in the first round. Of those to exit in round 1, Van Veen and Littler can count themselves particularly unlucky at losing out in their difficult first round ties, against the 3rd and 4th order of merit respectively. Pietreczko also put up a brave performance against Luke Humphries, but ultimately lacked the ruthlessness on the doubles to cause the eventual winners any trouble.
Michael Van Gerwen’s tendency closer towards the centre of the graphic also aligns with out understanding regarding the difficulty of opposition. Despite averaging numbers inferior to some of his competition, MvG did what was needed at the right time in order to make his way to the final. For me, another standout performer of the tournament was James Wade, who was given very little chance pre-tournament. Having only just scraped into the tournament in the first place, he managed to post an impressive 3 dart average, helped by a surge of 180s, as well as a very respectable checkout rate. It’s great to see a player of his quality returning to form, and the run to the semi-final was fully deserved, and in no part down to luck or fortune.
Wrap-up
In conclusion, the predictive model demonstrated its capability, alongisde areas of potential weakness, in the context of the 2024 World Matchplay. While it excelled in predicting clear favorites, it appeared to struggle more with closely matched contests. Such performance could likely lie within the expected levels of variance for darts matches at this level, so it will be interesting to see if this is the case when applied to future tournaments. Using this modelling approach for the PDC predictor was also highly effective, with consistently good performance across almost all rounds. I’m keen to put my skills to the test in future darting competitions, and continuing to hone my own skills, as well as tuning the models for more nuanced results in the future.