Algorithm on the Oche: Darts World Championship 2025
Keen to explore the ebb and flow of tournament odds in real time? Head over to my Darts Tournament Odds for a dynamic look at how probabilities shifted throughout the championship.
Algorithm on the Oche: Darts World Championship 2025
Right then, let’s delve a bit deeper into the thrilling spectacle that was the 2025 PDC World Darts Championship. As the tungsten dust settled over Alexandra Palace, the narrative was dominated by the meteoric rise of young Luke Littler. From December 15th, 2024, to a climactic January 3rd, 2025, the tournament delivered drama, skill, and a record-breaking victory that will be etched in darts folklore. The 96-player field battled for a share of the £2.5 million prize pot, with the coveted Sid Waddell Trophy and a cool half a million pounds awaiting the champion.
The tournament unfolded with a compelling storyline: Littler’s unprecedented journey to the top. His youthful exuberance and unwavering composure saw him dismantle opponents, culminating in a decisive 7-3 victory over the seasoned Michael van Gerwen in the final. His second-round masterclass against Ryan Meikle, achieving an astonishing 140.91 average in a single set, stands as a testament to the sheer talent on display. We also witnessed shocks and surprises, with reigning champion Luke Humphries falling to Peter Wright and Callan Rydz’s impressive quarter-final run. The roar of the Ally Pally crowd greeted two magical nine-dart finishes, courtesy of Christian Kist and Damon Heta, each earning a hefty bonus. The semi-finals set the stage for the grand finale, with Van Gerwen dispatching Chris Dobey and Littler overcoming Stephen Bunting, both with convincing 6-1 victories. In the end, Littler’s early dominance in the final proved insurmountable, securing his place in darts history. However, his journey wasn’t entirely smooth sailing post-championship, with an early exit at the Bahrain Darts Masters, where Stephen Bunting ultimately triumphed.
But beyond the human drama and the oche artistry, there’s another layer to this story – the analytical one. Before the first dart was thrown, algorithms were whirring, crunching data, and attempting to predict the unpredictable. This brings us to the heart of my analysis: how did my predictive model fare in the face of this exhilarating tournament?
Peering into the Predictive Crystal Ball
My model aimed to forecast the probability of each player winning their matches throughout the tournament, achieving an overall accuracy of 62.77% with 59 correct and 35 incorrect predictions. Let’s examine its performance, starting with the journey of the two finalists, Luke Littler and Michael van Gerwen.
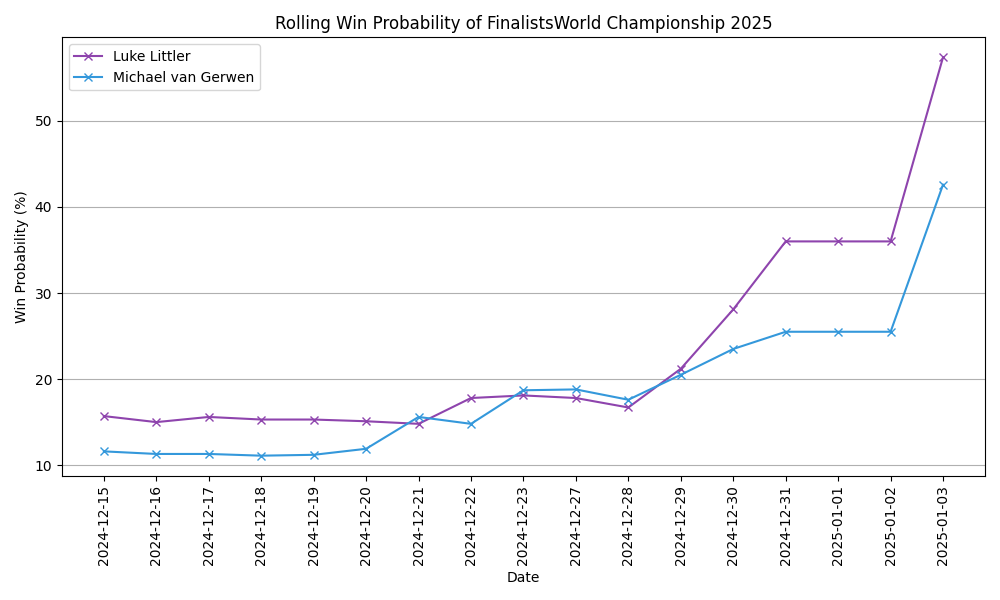 Figure 1: The changes in win probability of the two finalists throughout the tournament.
As we can see from the graph charting the rolling win probability, my model initially positioned Luke Littler as the favourite. However, there were periods, particularly when Michael van Gerwen was playing, where he edged ahead in the model’s estimations. The exit of Luke Humphries in the fourth round triggered a significant boost to Luke Littler’s odds, as they had been on a potential collision course for a semi-final, a match where Humphries was initially favoured by the model. This suggests my model was responsive to the unfolding dynamics of the tournament, adapting its predictions based on the latest results.
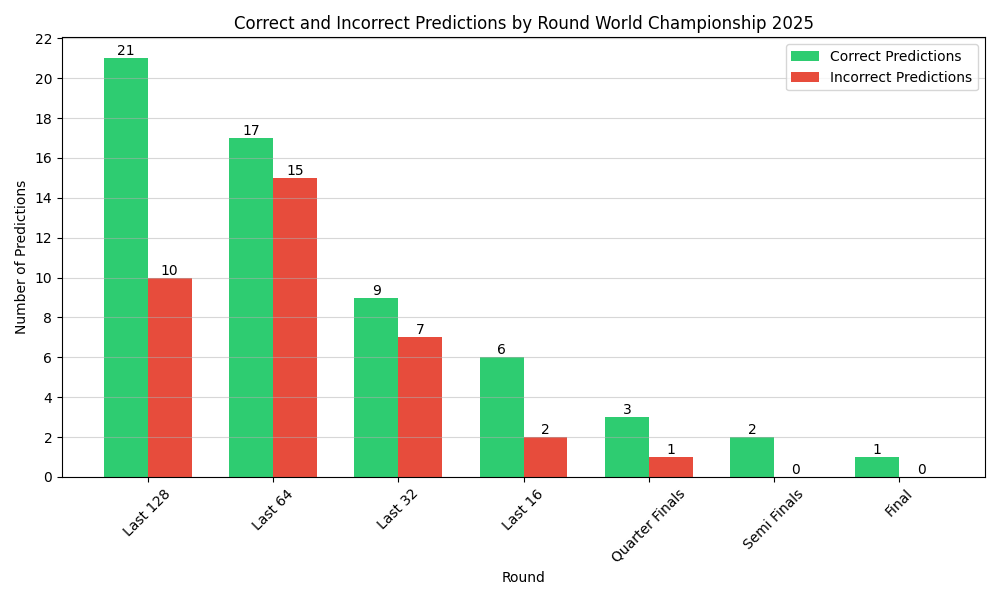 Figure 2: The number of correct and incorrect predictions made by my model at each stage.
Looking at my model’s accuracy on a round-by-round basis, we can observe some interesting trends. The bar chart illustrates the number of correct and incorrect predictions made by my model at each stage. Encouragingly, my model made more correct predictions than incorrect ones in every single round of the tournament. It performed particularly strongly in the latter stages, correctly predicting the outcome of 6 matches and incorrectly predicting only 1 from the quarter-finals onwards. While this smaller sample size might contribute to this apparent accuracy, it contrasts with the earlier rounds where there tended to be more variance in prediction accuracy, with the exception of maybe the first round and last 16. This is somewhat counter-intuitive, as one might expect more predictable outcomes in the initial rounds due to potential mismatches in player skill. Perhaps the set-play format, as opposed to leg-play in other tournaments, contributes to increased predictability in later rounds with more sets, or this could simply be due to statistical variance.
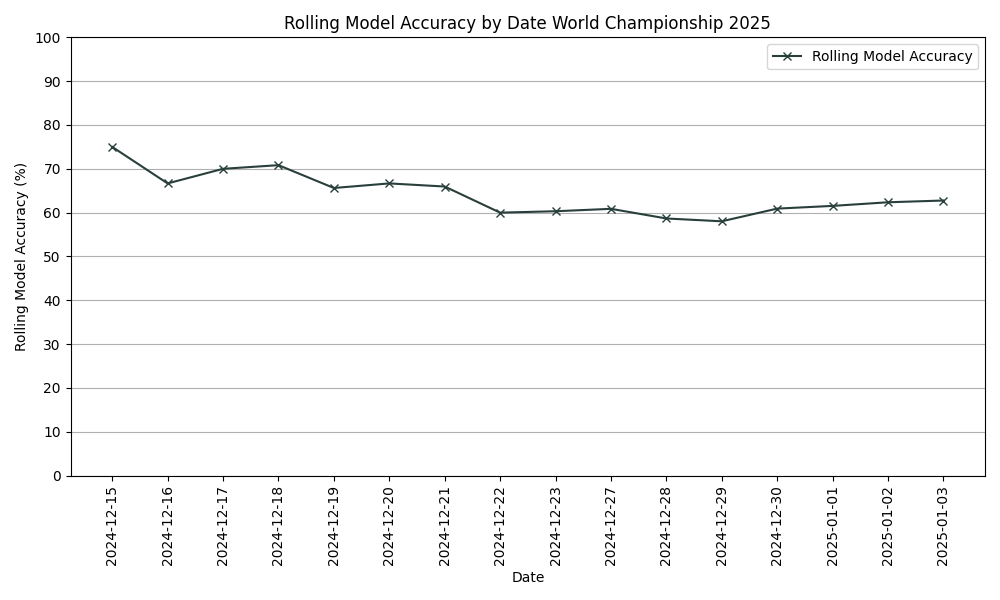 Figure 3: The rolling model accuracy throughout the tournament.
The rolling model accuracy provides a perspective on how my model’s overall performance evolved throughout the tournament. The graph shows the percentage of correct predictions over time. We can see that after some initial strong performance, the accuracy began to stabilise around the 62% mark from approximately the 22nd of December onwards. This suggests a reasonably consistent level of predictive capability was established as the tournament progressed, even amidst the inherent volatility of live sporting events.
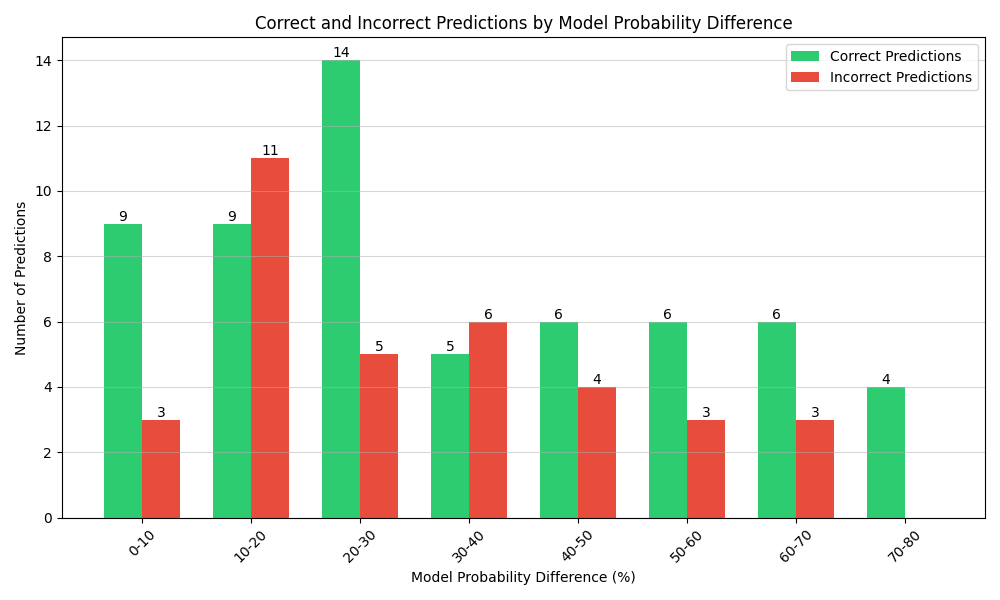 Figure 4: The number of correct and incorrect predictions made by my model at each stage.
Now, let’s delve into the relationship between my model’s confidence in its predictions and its actual success rate. This chart categorises predictions based on the probability difference assigned by my model. For example, the ‘0-10’ category represents matches where my model gave one player a win probability between 0% and 10% higher than their opponent. Interestingly, predictions in the 0-10% range were strongly favoured for correct outcomes. However, this trend didn’t perfectly hold, as the 10-20% range saw more incorrect predictions than correct ones (representing predictions where the probability was between roughly 55:45 and 65:35). Notably, all predictions where my model assigned a very high probability difference (70-80%) were correct. Conversely, other larger probability gaps surprisingly saw more upsets than one might statistically expect. This underscores the inherent uncertainty in forecasting sporting outcomes, even with sophisticated models.
Pre-Tournament Expectations vs. Reality
Let’s turn our attention to how my model viewed the pre-tournament favourites and how their actual performances aligned with these initial assessments.
| Player | Pre-Tournament Winning Odds (%) | Exit Round | |
|---|---|---|---|
| 0 | Luke Humphries | 21.4 | Last 16 |
| 1 | Luke Littler | 15.7 | Winner |
| 2 | Michael van Gerwen | 11.6 | Final |
| 3 | Josh Rock | 5.6 | Last 32 |
| 4 | Gary Anderson | 4.3 | Last 64 |
| 5 | Jonny Clayton | 4 | Last 16 |
| 6 | Mike de Decker | 3.7 | Last 64 |
| 7 | Stephen Bunting | 3.1 | Semi Finals |
| 8 | Wessel Nijman | 2.9 | Last 64 |
| 9 | Michael Smith | 2 | Last 64 |
The table presents the pre-tournament winning odds assigned by my model to some of the top contenders, along with their actual exit round. It’s fascinating to see that while Luke Humphries was the pre-tournament favourite according to my model, with a 21.4% chance of winning, his journey ended in the Last 16. Conversely, Luke Littler, with a pre-tournament probability of 15.7%, exceeded expectations spectacularly, going on to lift the trophy. Michael van Gerwen, given an 11.6% pre-tournament chance, also performed strongly, reaching the final. My model’s assessment of Stephen Bunting as a less likely winner (3.1%) was also somewhat off, as he made it to the semi-finals. These discrepancies highlight the challenges of predicting tournament outcomes based solely on pre-tournament data and underscore the impact of in-tournament form and momentum.
Reflections on Prediction and the Thrill of the Unexpected
So, what can we glean from this analysis of my model’s performance at the 2025 World Darts Championship? My model demonstrated a reasonable ability to track the shifting probabilities of the eventual finalists and showed a general correlation between its confidence and prediction accuracy. Its success in the early rounds was notable, and it became even stronger in the latter stages of the tournament. Both finalists, Luke Littler and Michael van Gerwen, were identified within the top three pre-tournament predictions, indicating a solid initial assessment.
However, my model, like any predictive system, wasn’t infallible. The unpredictable nature of individual match performances, the psychological pressures of the big stage, and the sheer brilliance of players like Luke Littler, who defied conventional expectations, all contribute to outcomes that can deviate from statistical probabilities. The early exit of the pre-tournament favourite, Luke Humphries, and Littler’s remarkable triumph serve as prime examples of the beautiful unpredictability that makes sports so captivating.
Ultimately, while data-driven models can offer valuable insights and probabilistic forecasts, they are not crystal balls. The 2025 PDC World Darts Championship, with its blend of established stars and emerging talents, served as a compelling reminder that in the world of professional darts, as in life, the unexpected can, and often does, happen. And that, perhaps, is where the true excitement lies.